A Visual Breakdown of Every NFL Draft Since 2000
With Python and Tableau I use distribution graphs & tables to visually display the last 22 NFL Drafts
The most boring month of the sports year is upon us - July. Although this year is much different because of the revised NBA and NHL schedules due to covid, typically the only sport to watch for most Canadians and Americans is mid-season baseball and maybe golf. Both can be fun to play but excruciatingly boring to watch.
For NFL fans July is traditionally reserved for frustratingly watching sports analysts predict the Cowboys to win the Super Bowl. It’s the same story every year even though they have only won THREE (3) playoff games since 1996.
It’s also a great time to prepare for fantasy football. Fans are trying to get their draft order set and begin strategizing for their draft. One of the hardest things to do, is to try and decide which new draft picks will stand out and which ones will be duds. That got me thinking, I wonder what kind of players are taken in the draft and from what schools over time. I decided it would be fun to aggregate NFL draft data from 2000–2021 and display it visually.
I used some web scraping to get the dataset I am using. Here is the code for the web scraping portion, here is the code and dataset I used for this blog. I also uploaded the dataset on Kaggle if you’re interested.
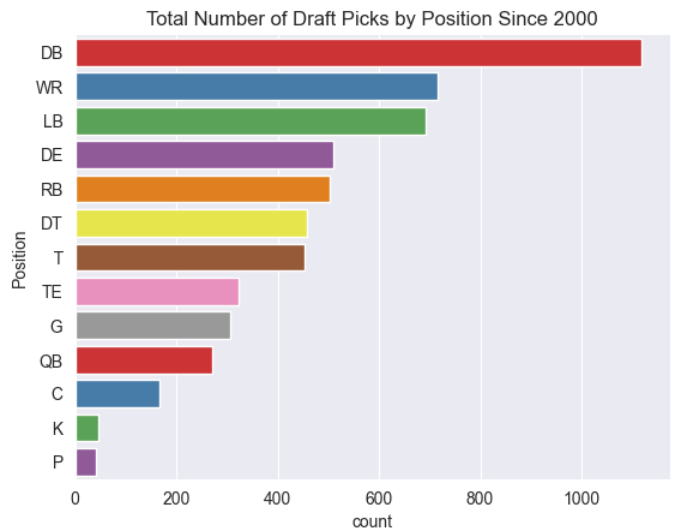
This first graph shows us the breakdown of every player taken by position. Surprisingly to me, DB is the leader by hundreds. However, it should be noted that DB is a position group which includes CB, FS and SS while some position groups are broken down like Defensive Line (DE, DT) and Offensive Line (T, G, C).

This next series of graphs show the top 5 most popular positions taken in each round since the year 2000. DBs are by far the most popular choice in every round and WR + LB are second and third with exception the first, where DE and T beat out LB. With D-linemen, RBs and Ts rounding out the rest of the top 5 in all the other rounds. Positions that aren’t in the top 5 in any round are QB, TE, G, C, K, P.


Here is a round by round breakdown of the total picks since 2000. Not many surprises on this one. The NFL usually “adds” extra picks to later rounds. From NFL.com:
“Under the terms of the NFL’s collective bargaining agreement, the league also can assign as many as 32 additional “compensatory free agent” picks, which allow clubs that have lost free agents to another team to use the draft to try to fill the void. The awarded picks take place at the end of the third through seventh round.”

Next, let’s take a look at which schools are the most popular for each position. I can’t say that I’m very surprised by any of these. Every position has 5 of the top schools in the nation (perennially). Every school but one are from the Power 5 conferences: Big 10, SEC, ACC, Big 12 or Pac-10. The only one I found from outside the Power 5 is Memphis which had a few Kickers taken in the last 22 years. Notre Dame which was technically ACC but only recently and they’re still independent (kinda). However, they were independent when most of this data was collected.


And here are the top 25 schools and a breakdown of their players drafted by position. Ohio State is leading the pack in Centers, DBs and LBs while Alabama leads in DT, T and RBs and is near the top in almost every other category.

This table is more about quality than quantity and measures which rounds their players were drafted in. Every NCAA Football champion since 2000 is on this list and the teams that won multiple titles during that time tend to have darker colored cells — which makes sense.

Here is an aggregated graph of the above table and it’s sorted by total number of players drafted.

Want to know how your team drafted the last 22 years? Here is a positional breakdown by team. I did this programmatically, so the colors are random.


These 2 graphs depict the number of picks by position and round per NFL team.


These next two graphs show the total picks since 2000 per NFL team and breakdown the number of picks per team by year during that time period.


Here is the average pick position by round for each NFL team. Having a lower number generally means that the team has been one of the lower performers the last 22 years. Notice the lowest 5 scores in the first round: Jaguars, Washington Football Team, Browns, Lions and Cardinals. Each of those teams has had a few good years during that span, but were typically in the bottom third of the league in win pct.
Now look at the top 5 teams in the first round: Patriots, Colts, Steelers, Ravens, Packers. These 5 teams have had a lot of success in the last 22 years and represent over 50 % of the Super Bowl winners from that time — Patriots (6), Ravens (2), Steelers (2), Colts (1), Packers (1).

That’s it! I hope you were entertained by the visuals and had some fun. This is my first blog on this platform and I hope to post more visualizations related to topics I find interesting and data science.
Feel free to reach out and connect on LinkedIn , I love connecting with new people.


